Table of Contents:
Rationale
What is React Native and why should I care?
React Native is a mobile development framework that allows mobile application developers to write their code in JavaScript (JS), and write it once. No need to know both Kotlin and Swift, as the same JS code base will compile to the appropriate “native” components for both Android and iOS platforms. The resulting React Native app looks really different than old-fashioned ones. Classic Reverse Engineering tools like decompilers are useless. Changing the JS code and watching the results currently requires repackaging of the APK which is a very slow and tedious process. A previous method was presented by NCCs Jeff Dileo in 2017, but still requires replacement of device files and some C code. Conversely, the technique presented here radically streamlines live-editing of third-party code.
React Native Primer
Before describing the magic, we need to lay the groundwork with some React Native basics. Feel free to skip to The Technique if already familiar, or even jump straight to the code.
Without going into much detail about React Native itself, as any reverse engineering effort, we must first understand the engineering behind it, so here’s some quick bits:
-
To get a feel of the developer workflow, I’ll list some boilerplate commands they would run:
-
Install react native CLI and start a project from a template
$ npm install --global react-native # officially discouraged, instead: fetch always-latest and run CLI command using: # npx react-native <command> $ react-native init rnproject -
Write code in the provided
App.js,index.jswhich is just the historical entry point, and other JS files. Need functionality not covered by the bare library? Browse “modules” from https://reactnative.directory/ and install.$ code *.js $ code *.js $ code *.js $ npm install react-native-* -
Start a local dev-server (port 8081) to interact with the running app, package and serve the bundle (more on this later)
$ react-native startWhich looks like this:
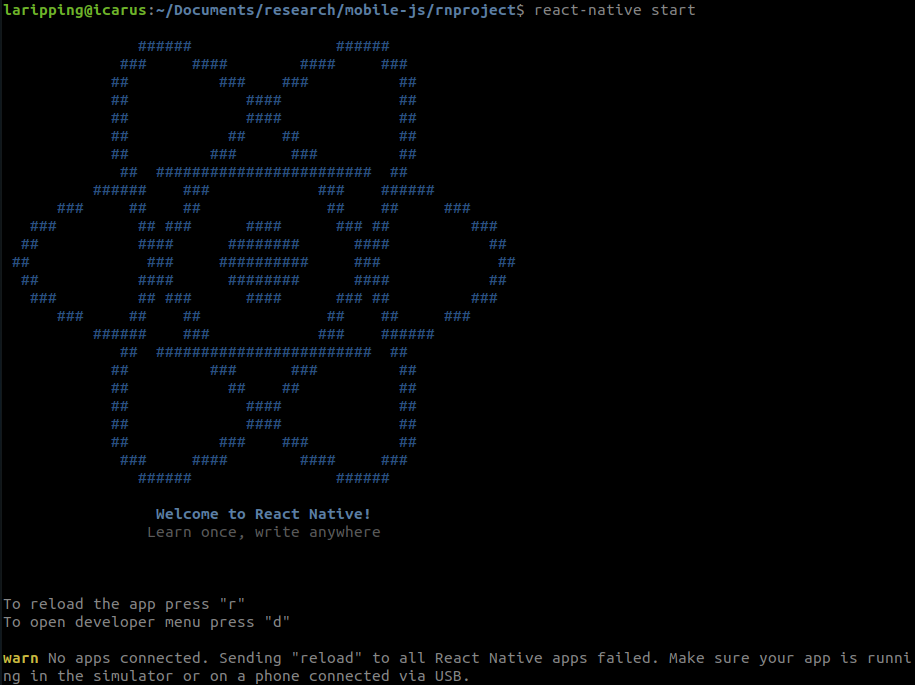
-
(in another terminal) Build, install & run the app on a connected device or emulator with a single-command
$ react-native run-android
# similar to
$ cd android/
$ ./gradlew assembleDebug
And you get the sample app:
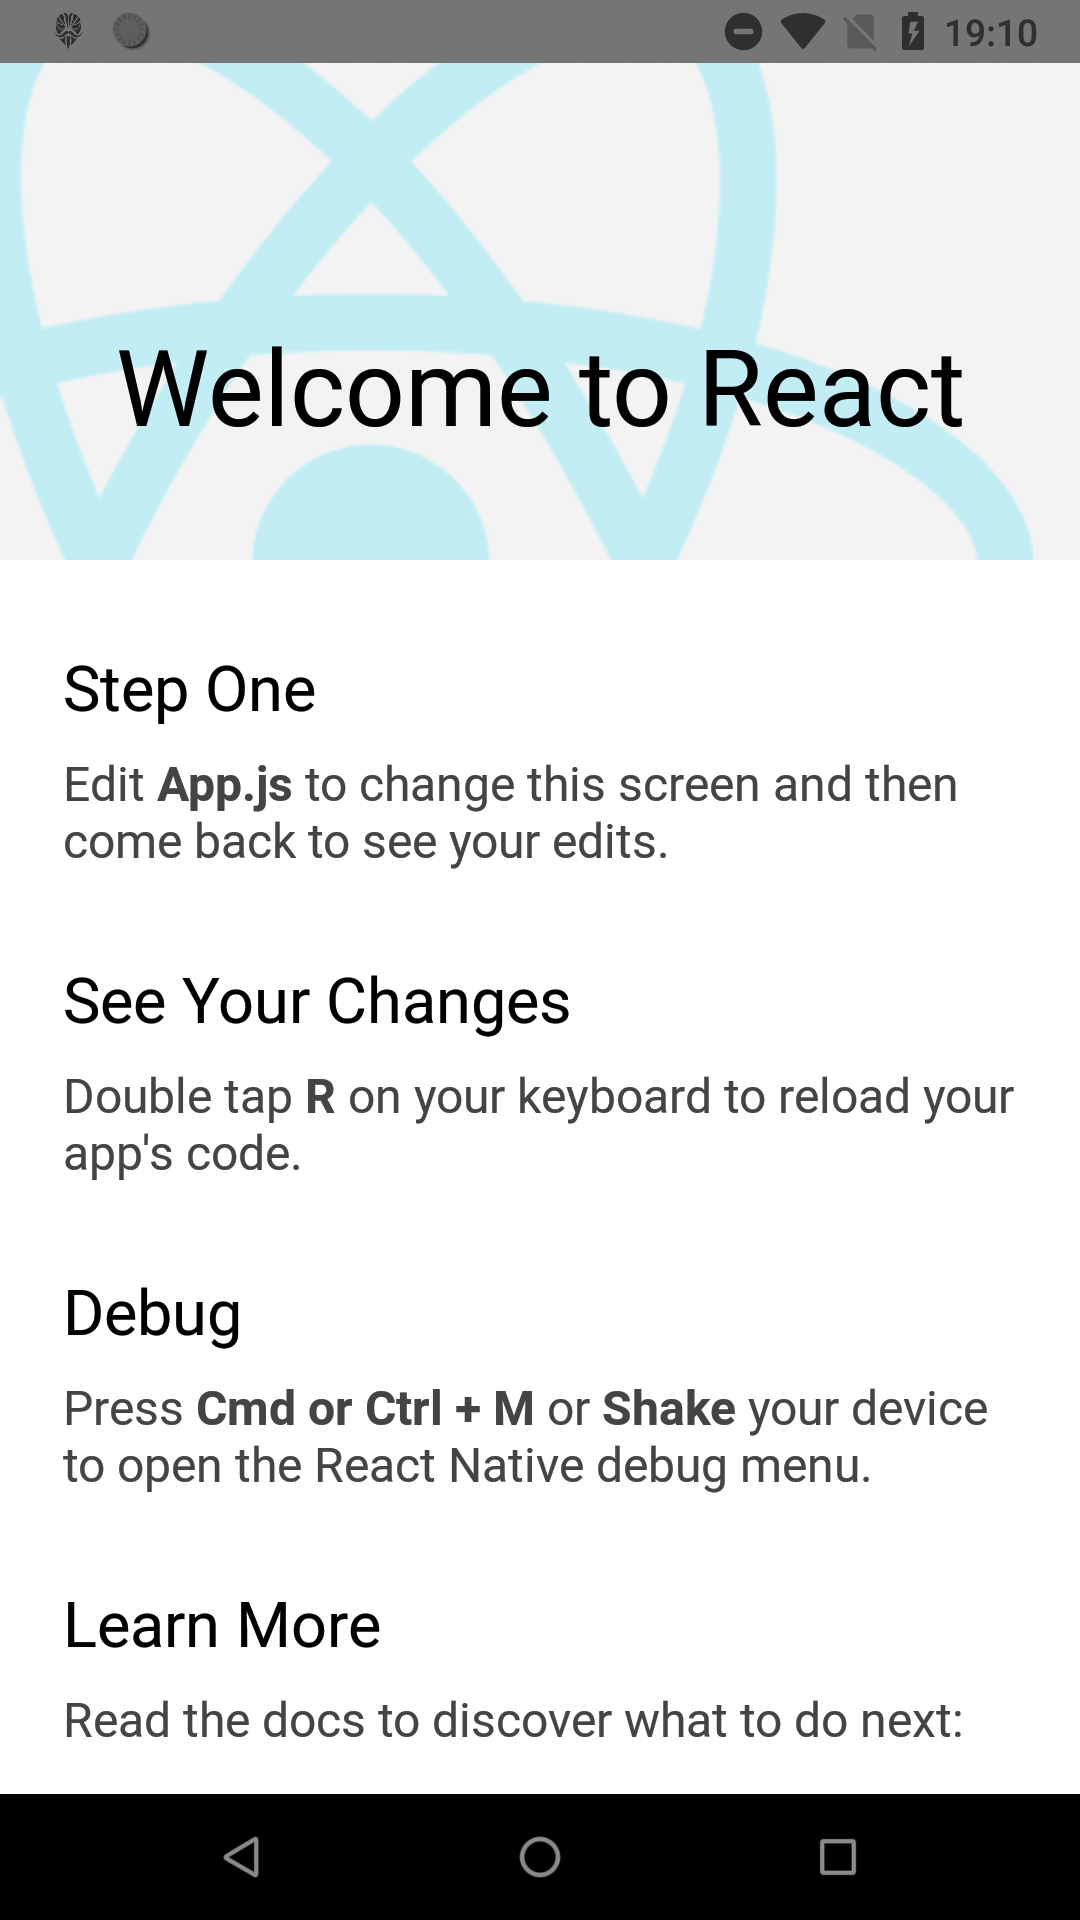
-
To buld & sign a release variant, ready for Play Store:
$ react-native run-android --variant=releaseBoth commands included a build step (gradle task) that packages all the JS code into a single file termed “bundle”. This is then placed inside the APK at
/assets/index.android.bundle. For release variants, the bundle is also minified and (optionally) stripped of log statements. -
To perform only this last step, or insert React Native functionality to existing apps, just create the bundle from the JS files & modules with
$ react-native bundle
-
-
When running debug builds, there’s React Native provides a Developer menu seen on the left picture below, which appears when “shaking” the device, or faking a “Menu” button click with
adb shell input keyevent 82. Clicking the last option of this menu gets you to the screen on the right: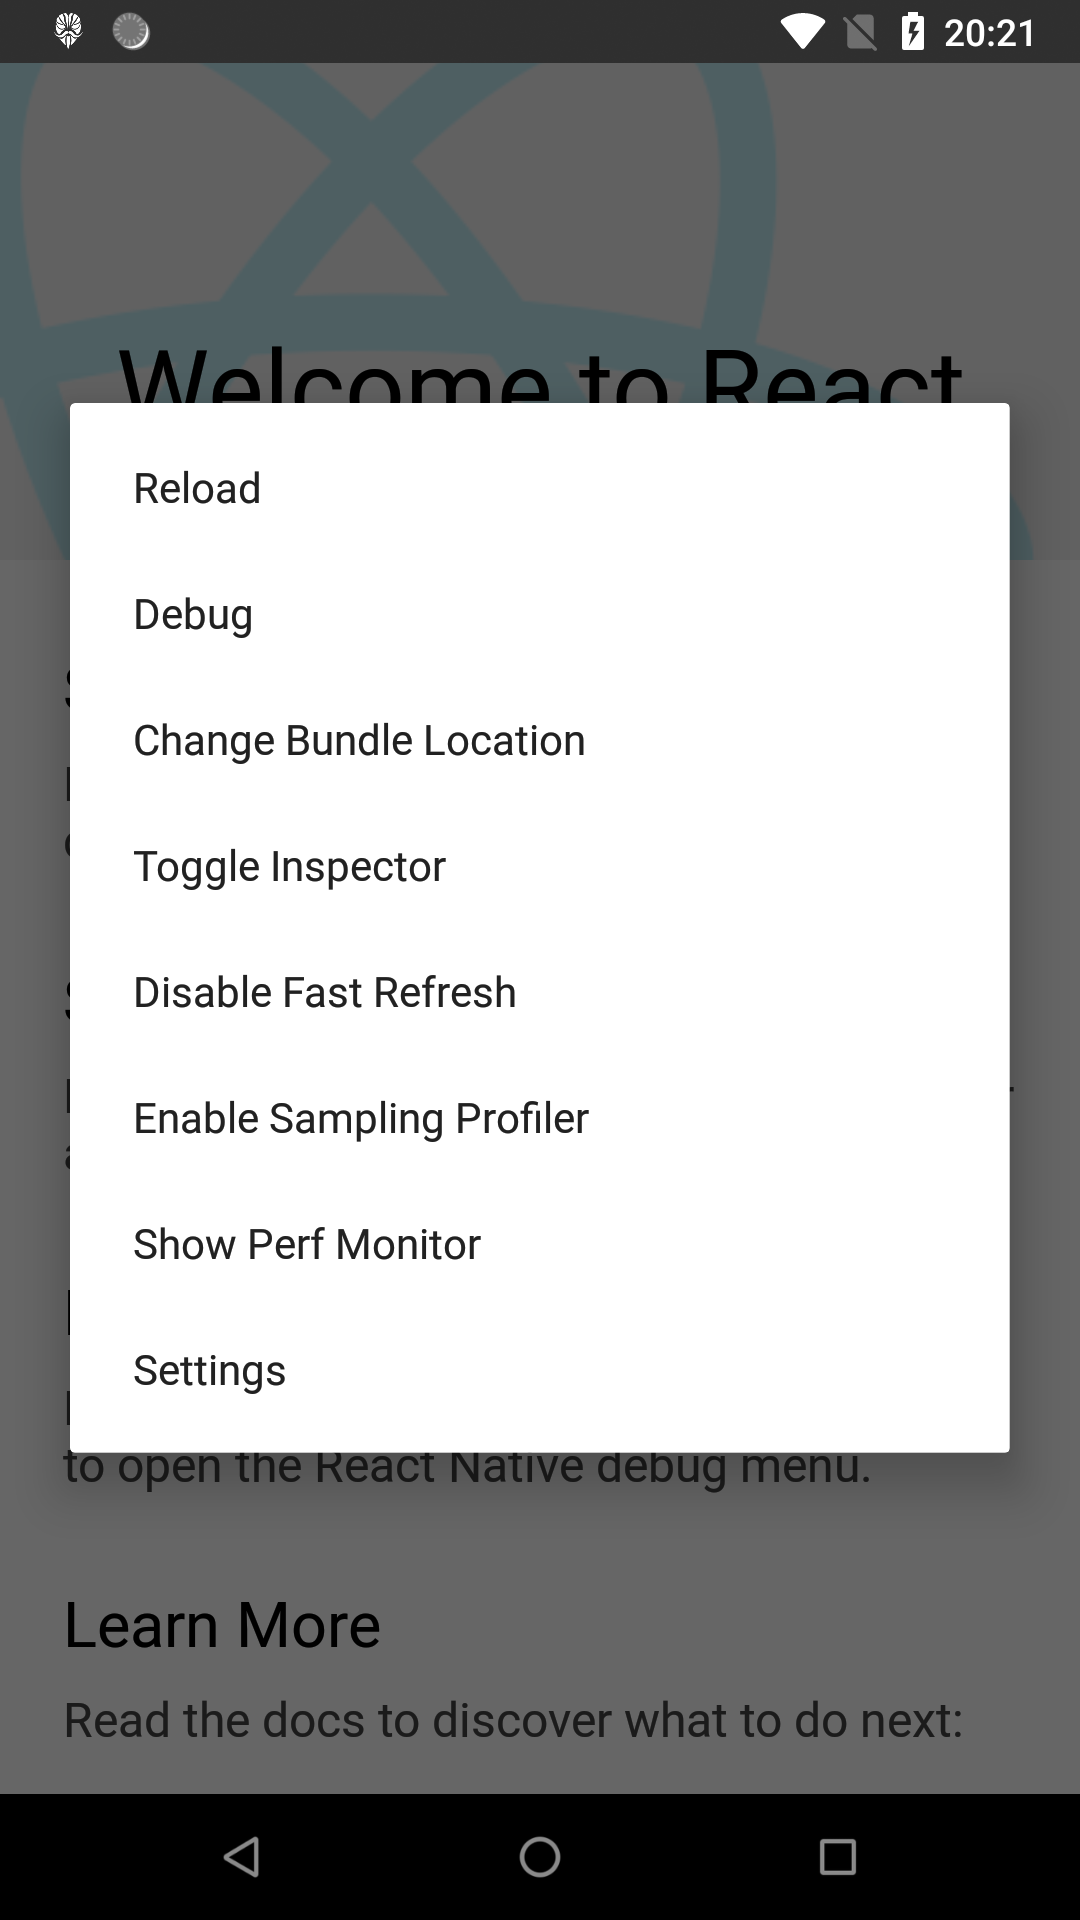
-
From this menu, clicking “Debug” will trigger one of the following tools on the development box side, to facilitate full-blown debugging. Under the hood, this changes the execution context of the JS bundle from the device’s JavaScriptCore engine to Chrome’s
debuggerWorkerthread powered by V8 engine.-
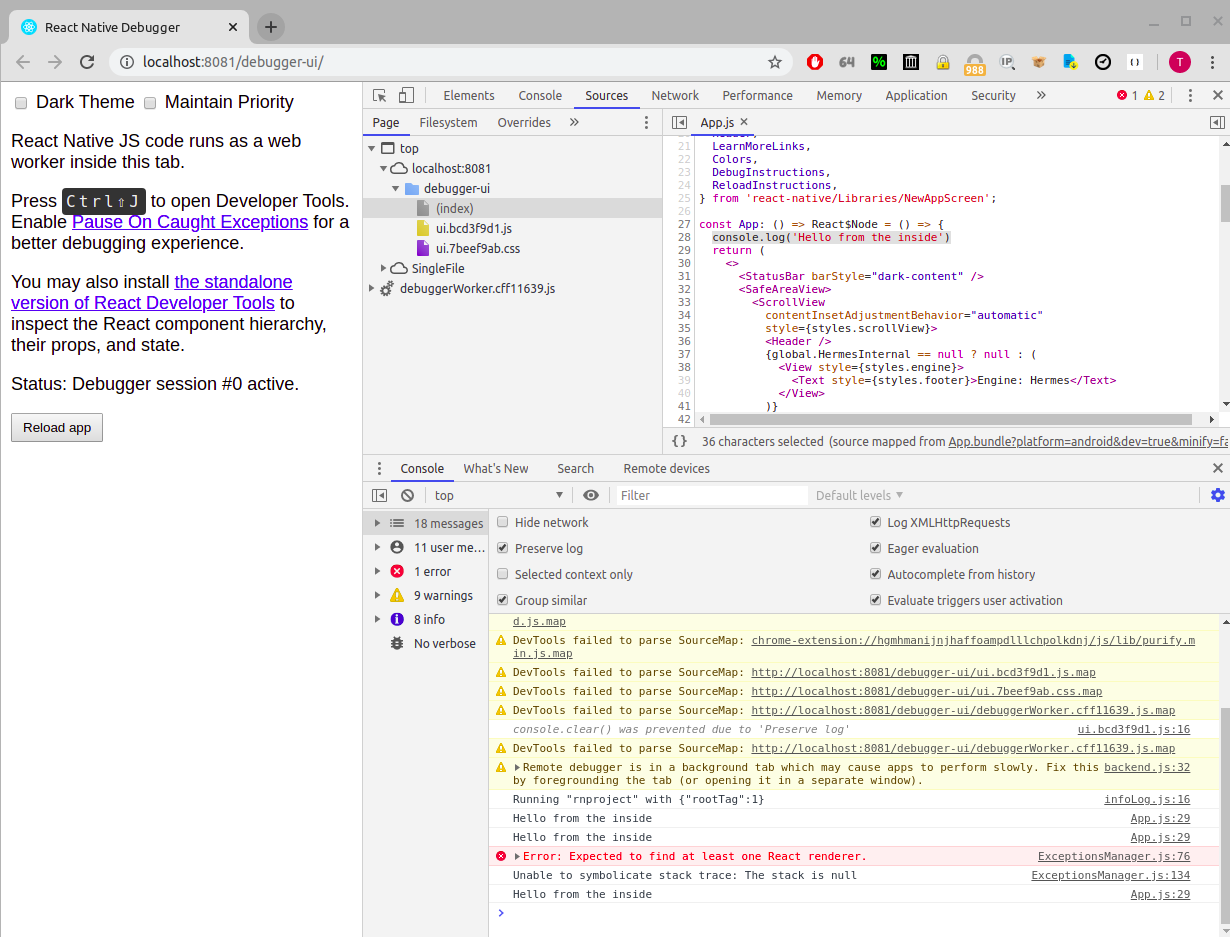
Chrome Dev Tools: If not open, point a new tab to localhost:8081/debugger-ui To view the Console and Sources tabs, as if you’re debugging a web application’s JS code.
-
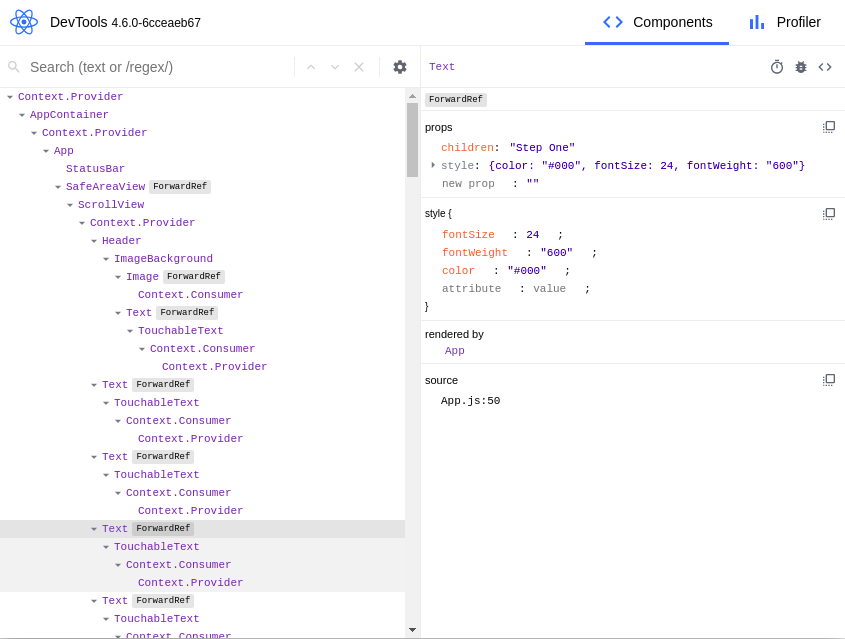
react-devtools. This is an official npm package for React Component introspection. All you need is:$ npm install --global react-devtools $ react-devtools…and you get:
-
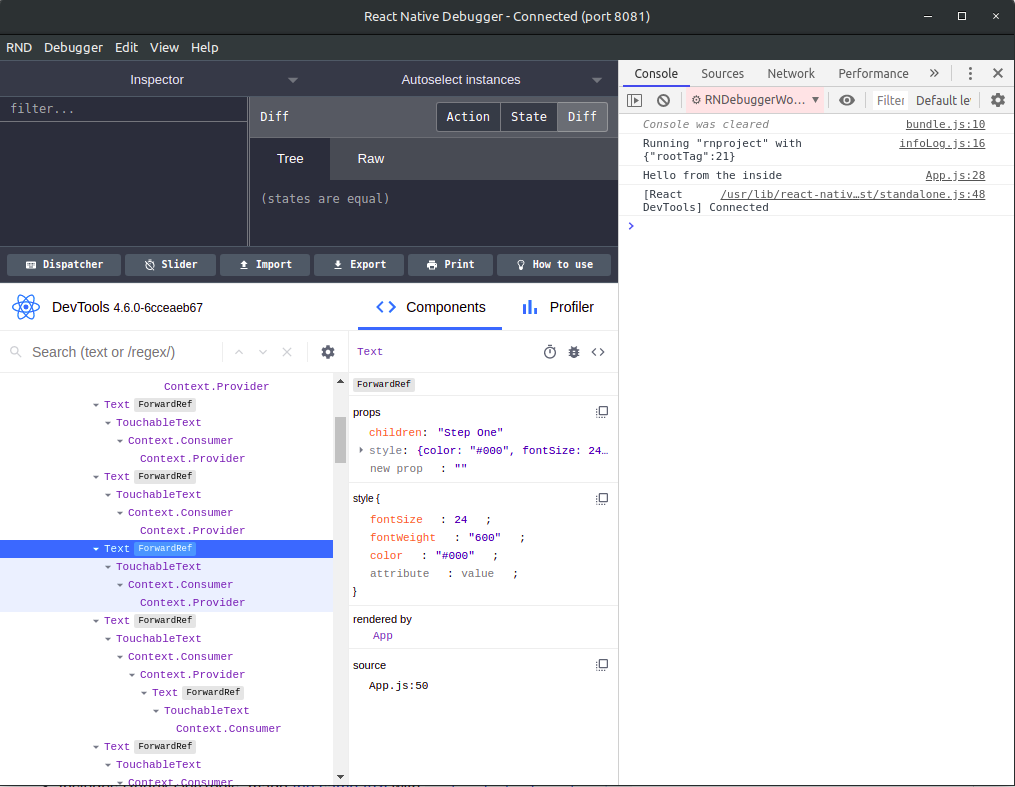
react-native-debuggerThis is a standalone Electron app combining all the above (Chrome & React Dev Tools) plus another tool called Redux debugger which is out of our scope. Using it is as simple as:$ wget https://github.com/jhen0409/react-native-debugger/releases/<latest>.deb $ dpkg -i react-native-debugger_0.11.1_amd64.deb $ react-native-debuggerThis looks like:
The application communicates with all these tools over HTTP(+websocket) interfaces by reaching
localhostserver as some previousadb reversecommands have forwarded the ports to the device side. -
-
In terms of Logging messages sent from the JS code (e.g. by
console.log) are dumped inlogcatif not stripped during packaging, but can also be isolated with a react-native command, for Dev builds. The command and its output are shown below: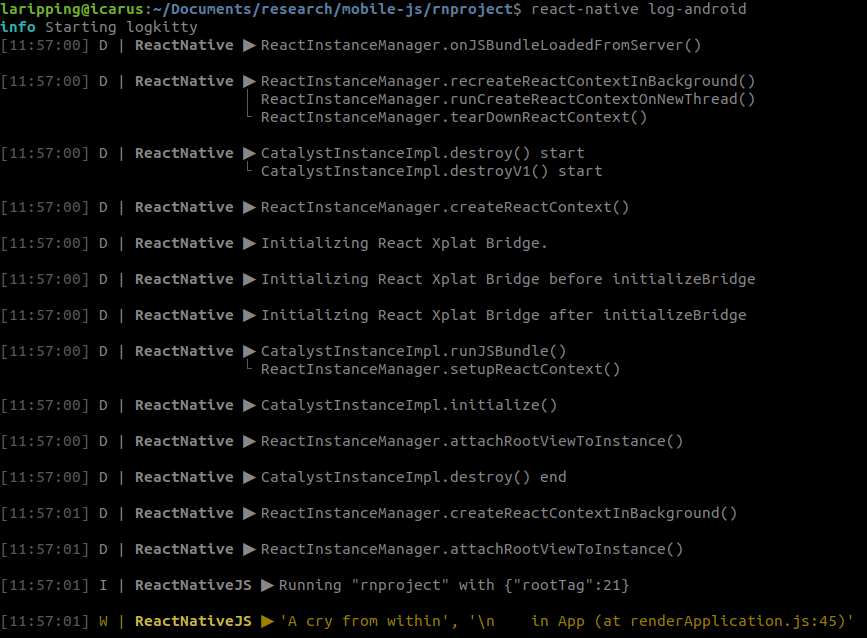
With these in mind, let’s now dive into the actual technique discovered. Or more accurately, the road leading to it, for a start. Feel free to jump to the gist if impatient.
The Technique
So the idea was to enable debugging capabilities and force this “development” context for third-party applications straight out of Play Store. That’s right, with no source, no ownership of the codebase.
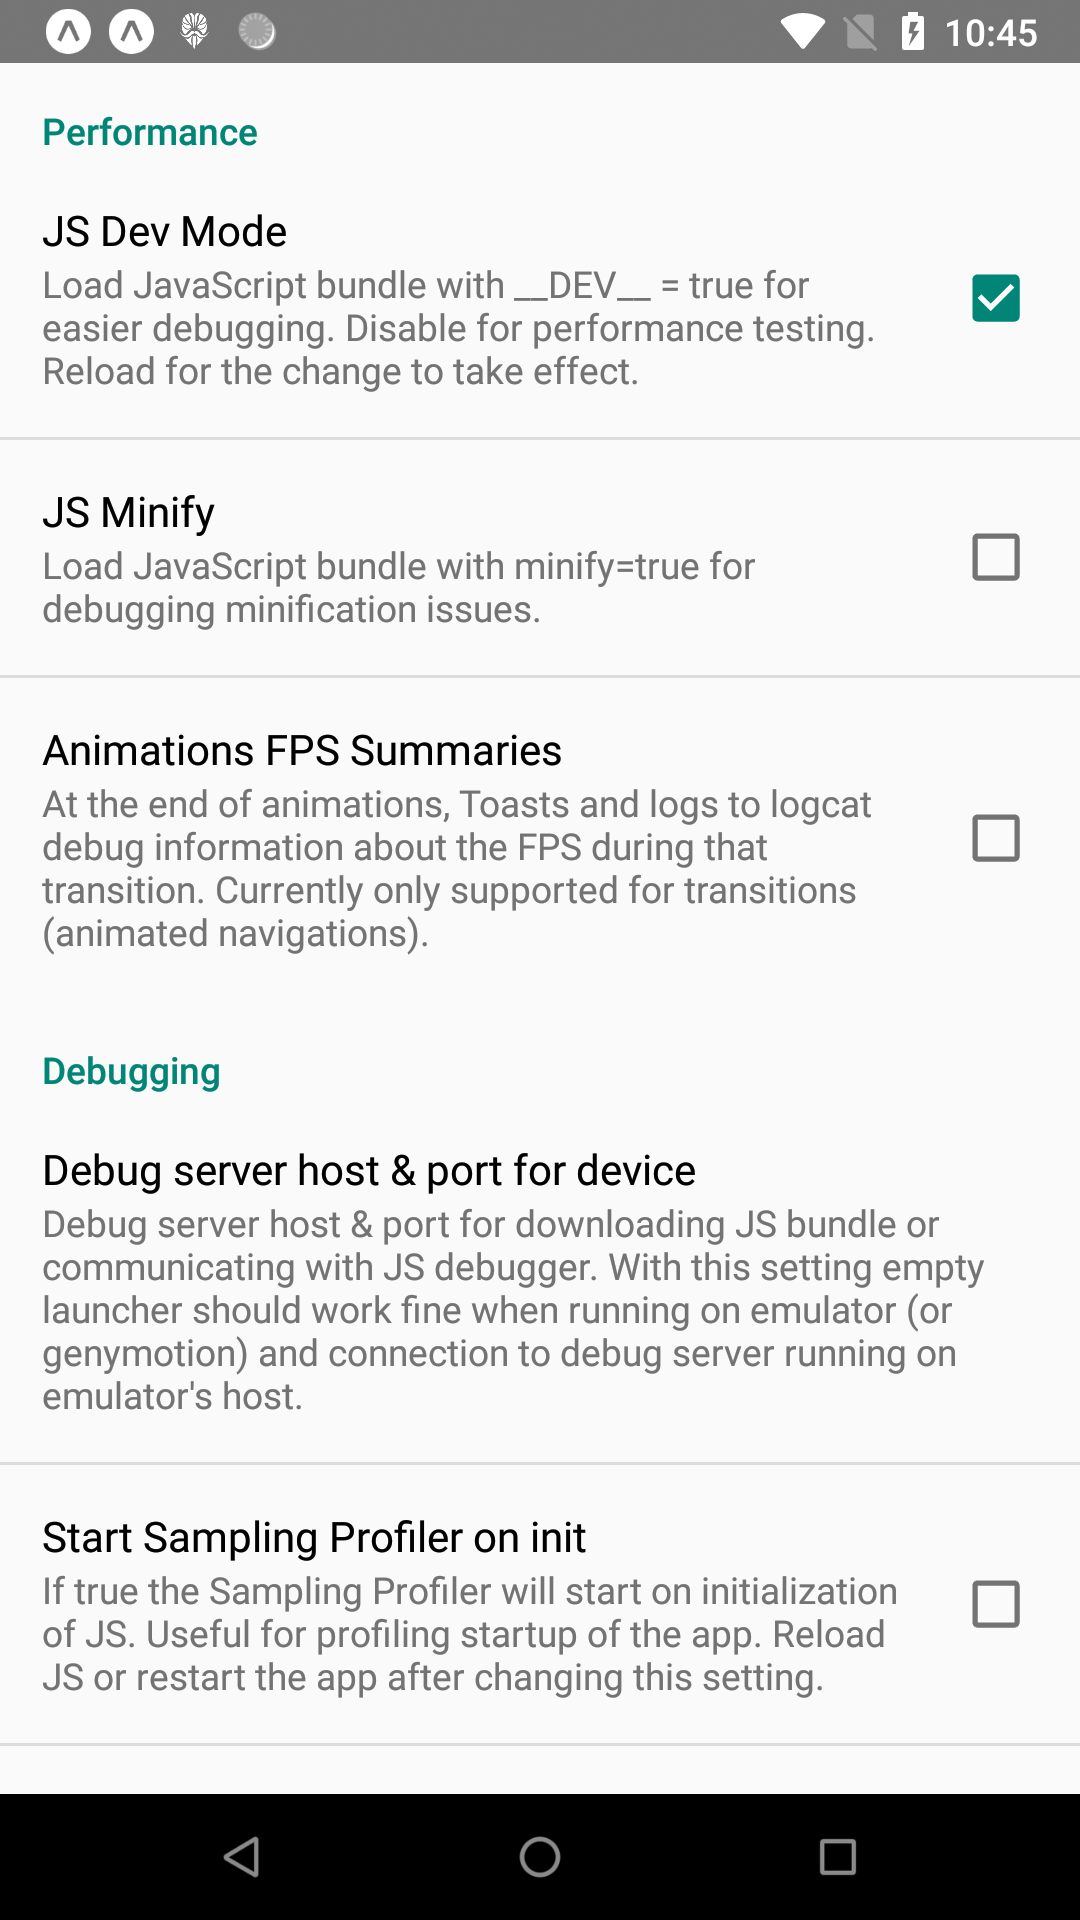
I created a demo app in seconds (kudos to React Native), and built a release APK to analyse, as if I just downloaded this from e.g. APKpure. The first thing that came to mind was to locate and enable the DEV flag on the JS bundle. So I repackaged my app using apktool with a single modification: Replaced the __DEV__=false instruciton early in the bundle, to __DEV__=true. Re-installed the app, started my Dev Server and nothing happened. No request to port 8081, no Dev Menu when I shook the device. However, manually opening the Dev Settings (adb shell su -c "am start <packagename>/...DevSettingsActivity) we see the “JS Dev Mode” checkbox enabled…
Searching around I bumped into an eye-opener which helped me realise there are 2 components that should be in DEV state: the JavaScript and the Native (Java) code. The above process only switched the JavaScript counterpart to DEV but left native to a production context. The native code responsible for all the DEV stuff is part of the react-native core module, and lies on the com.facebook.react.devsupport package. So essentially, the critical bits to investigate are under node_modules/react-native/ReactAndroid/src/main/java/com/facebook/react/devsupport/. In detail, the decision to include this package’s functionality or not, is located in the DevSupportManagerFactory class:
public static DevSupportManager create(..., boolean enableOnCreate){
	if (!enableOnCreate) {
		return new DisabledDevSupportManager();
	}
	try {
		String className = "com.facebook.react.devsupport.DevSupportManagerImpl";
		Class<?> devSupportManagerClass = Class.forName(className);
		...
The enableOnCreate argument is traced back to an abstract class ReactNativeHost which -the way React Native works- is instantiated by our own application’s class!
package com.rnproject;

import android.app.Application;
...

public class MainApplication extends Application implements ReactApplication {
  private final ReactNativeHost mReactNativeHost =
      new ReactNativeHost(this) {
        @Override
        public boolean getUseDeveloperSupport() {
          return BuildConfig.DEBUG;
        }
In the excerpt above we see that the inclusion of Developer support code boils down to the BuildConfig.DEBUG, replaced by Gradle on buildtime, so after decompilation it looks like this:
package com.rnproject;

import android.app.Application;
...

public class MainApplication extends Application implements ReactApplication {
    private final ReactNativeHost mReactNativeHost = new ReactNativeHost(this) {

        public boolean getUseDeveloperSupport() {
            return false;
        }
Now I knew what to change on my next attempt!
To locate the overriden getUseDeveloperSupport() function we must keep in mind smali displays nested classes with the nesting class’s name appended with a dollar sign $ (fun fact: that’s also what Frida does). So the class we’ll modify is:
smali/com/rnproject/MainApplication$1.smali
The smali code looks like this:
.class Lcom/rnproject/MainApplication$1;
.super Lcom/facebook/react/ReactNativeHost;
.source "MainApplication.java"

...
# virtual methods
.method public getUseDeveloperSupport()Z
    .locals 1
    const/4 v0, 0x0				# replace this to 0x1
    return v0
.end method
After surgically changing just this one character I once again, re-built the apk, signed and installed to the device. On the connected dev-box side, I prepared with react-native start and BOOM, I’m immediately greeted with the green top bar! We’re even presented the Dev Menu when shaking the device!
Are we done? No, there’s a catch… In a dev variant the bundle is fetched from the packager, as can be seen in the screen on the left. This request is however successful only because the packager was started from the directory of our own project, and therefore packaged the code already found there, a luxury we won’t have with third-party apps.
Let’s try from a different folder then, starting with react-native init fakeapp. This will result in the default package name of com.fakeapp assigned by react-native-cli. Upon request of the /index.bundle?... an error is spawned in LogKitty & the app screen:
[14:36:44] E | ReactNativeJS ▶︎ Invariant Violation: "rnproject" has not been registered. This can happen if:
                             │ * Metro (the local dev server) is run from the wrong folder. Check if Metro is running, stop it and restart it in the current project.
                             └ * A module failed to load due to an error and `AppRegistry.registerComponent` wasn't called.
Which means the packager builds and serves an index.js bundle from the code found in our directory. We want to make it serve an existing bundle, the one we extracted from the decompiled app.
If we place a file named index.bundle in the root directory, the packager is going to serve this instead of packaging any JS found there as part of the template.
Re-trying throws this error:
Refused to execute script from 'http://localhost:8081/index.bundle?platform=android&dev=true&minify=false' because its MIME type ('application/octet-stream') is not executable, and strict MIME type checking is enabled.
Ok, let’s rename it to index.js then… And it works!
-
index(.native|.android.js|.native.js|.js| .android.json|.native.json|.json|.android.ts|.native.ts |.ts|.android.tsx|.native.tsx|.tsx)-
index/index(.native|.android.js|.native.js| .js|.android.json|.native.json|.json|.android.ts|.native.ts |.ts|.android.tsx|.native.tsx|.tsx)
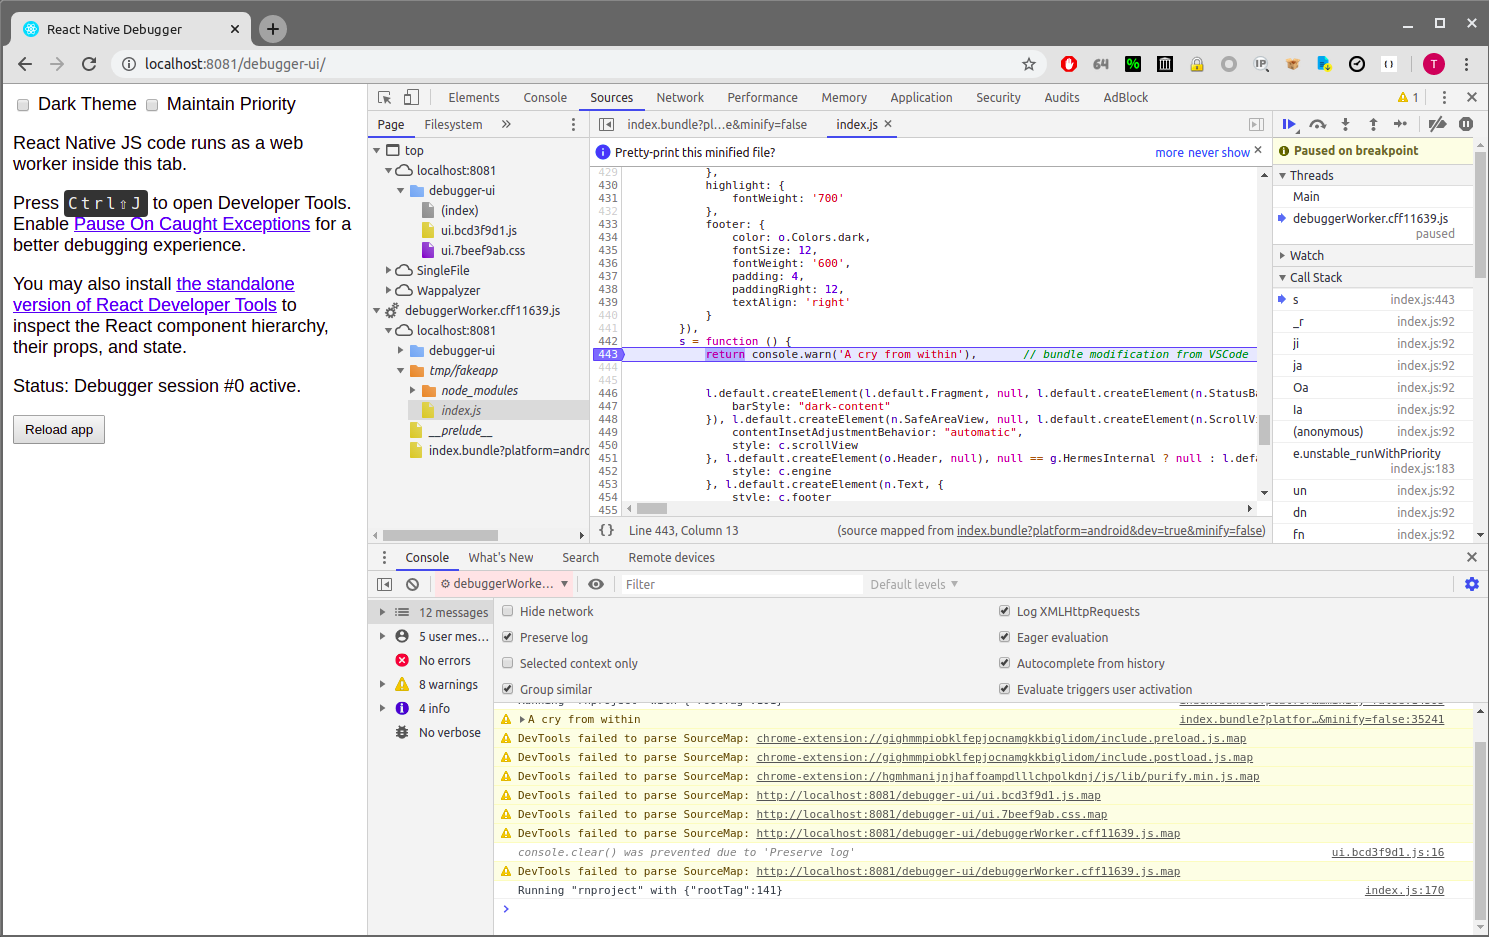
Even the debugger works! In the Inspector window below, we have updated the now local index.js , right from the Sources tab (prettyfying it and adding a comment), then set a breakpoint on the logging statement and the device has successfully stoped in this point!
So let’s summarise what we have achieved here, along with some things we haven’t.
| Given a third party app | We now have a working version of it |
|---|---|
| ...with a DEV=false JS bundle | ...with a DEV=true JS bundle |
| ...with release RN Java code | ...with debug RN java code |
| so no Developer menu | which allows Developer menu |
| no breakpoints | we can set breakpoints* |
| logs from JS appearing in logcat without context |
logs from JS appearing in logcat and Chrome Console with full JS context* |
|
had to repackage teh APK every
time to see modifications |
and just Dev-Reload to see JS
modifications (by Shaking or pressing 'd' on the Dev Server terminal ) |
| no React Component inspection | still no React Component Hierarchy inspection |
| no Redux Dev Tools | still no Redux Dev Tools |
*Not universally possible for all apps. Keep reading.
TL;DR
Summarising, the steps to reproduce for any app are the following:
$ apktool d app.apk -o app.out/
$ cd app.out
$ sed -i 's/__DEV__=false/__DEV__=true/g' assets/index.android.bundle
$ code smali/.../MainApplication\$1.smali	# VSCode = best JS IDE. Fight me
$ # locate
$ #		getUseDeveloperSupport()Z
$ # and change
$ # 	const/4 v0, 0x0 to 0x1
$ apktool b -o app-repkg.apk app.out
$ apksigner sign --out app-repkg-signed.apk --ks mine.keystore app-repkg.apk
$ adb install app-repkg-signed.apk	# uninstall if already installed, to avoid error based on different signatures
$ cd ../

$ react-native init rndir
$ cd rndir
$ mv index.js index.js.bak
$ cp ../app.out/assets/index.android.bundle index.js
$ react-native start --verbose
As a bonus, if the bundle’s source map file is found in the assets/ directory , we can include that in Chrome’s Developer Tools, to effectively inverse the minification process. This can be done in 2 ways:
-
Right Click the code on the “Sources” tab and click “Add Source map”. Then point to the
.mapfile.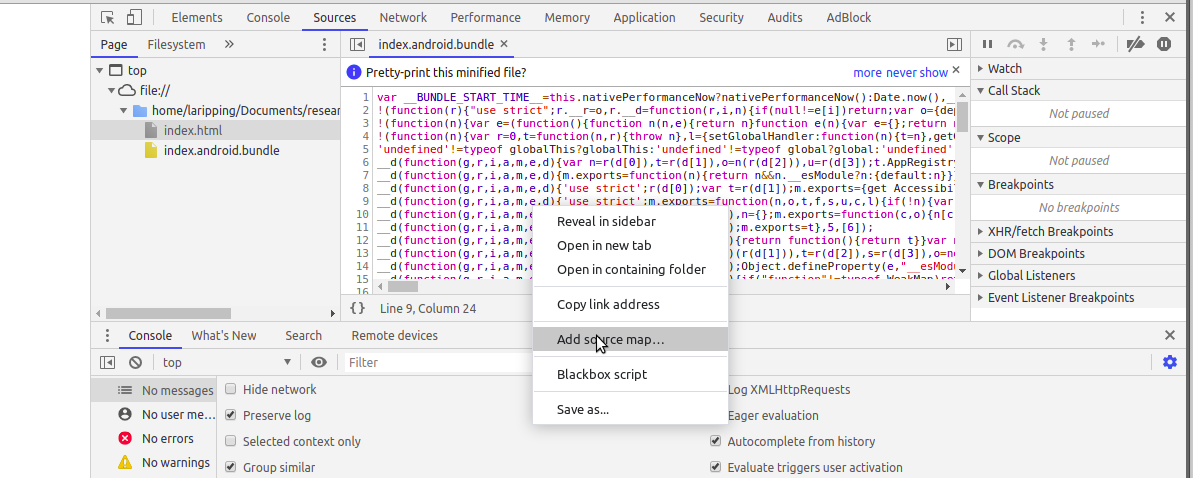
-
Replace the last commented line of the bundle file with the location of the .map file, relative to the index location on the disc. This will look like this:
//# sourceMappingURL=index.android.bundle.map
To further prove the validity of the technique, I embarked on a journey across the seas of React Native apps. I faced some common problems To further prove the validity of the technique, I embarked on a journey across the seas of React Native apps. I faced some common problems the solutions of which -not all unfortunately- I’m providing in the next paragraph. Initially starting with the app that sparked this whole research, a mature, production application from a client, built in react native from scratch. After following the steps, I did see the local bundle being fetched from my dev server but end-to-end debugging of a running state failed due to Caveat #5 below, which is sadly non-fixable… But let’s list from the start, some things that could go wrong:
Caveats
-
Locating the
getUseDeveloperSupportdefinition can be tricky. For example, apps usingreact-native-navigation, a very popular navigation module, delegate thegetUseDeveloperSupport()decision tocom/reactnativenavigation/react/NavigationReactNativeHostclass which eventually leads to aisDebug()overload on theMainApplicationclass.Solution: Override
isDebug()instead, to return 0x1. -
Older versions of react-native initially request /index.delta?… from the Packager, instead of /index.bundle?… … is it the same? Digging into this older version’s
ReactAndroidrevealed that this “delta” file should be a JSON object. An empty one is handled ok by the device, but freezes the app forever as it effectively means that no changes have been made… to the empty bundle. (0+0=0). Now we must figure out how a properindex.deltawould have to be like to serve our whole JS bundle (0+100=100%).I let the packager do it for me! …by tweaking the steps above to start a project with older react-native from and therefore older packager. Then intercepted what packager sent and saved it.
$ npm install react-native-cli $ react-native init rndir --version 0.59.8 $ cp $APKTOOL_DIR/assets/index.android.bundle rndir/index.js $ cd rndir $ react-native start --verbose # Start app -> Shake -> Reload -> Intercept initial "GET /index.delta" response from wireshark -> Follow HTTP stream -> Save as "index.delta"Solution: Place all of the
index.jscode inside theprekey of a JSON file based on the template below, save it asindex.delta. It should look like this:{ "base": true, "revisionId": "d85b12235ad3af16", // arbitrary 16-hex-char ID "pre": "var __DEV__=true,__BUNDLE_STA....all of index.js", "post": "__r(0);\n", "modules":[] } -
A side effect of Dev Mode is that it forces the assets (=images) to be fetched from the Dev server instead of local locations. This will lead to errors like:
Error: ENOENT: no such file or directory, scandir '/tmp/bdir/src/icons'
::ffff:127.0.0.1 - - [16/Apr/2020:11:11:59 +0000] "GET /assets/src/icons/x@3x.png?platform=android&hash=59a3b70bc14539a42f4ce9d18d304125 HTTP/1.1" 404 - "-" "Dalvik/2.1.0 (Linux; U; Android 8.1.0; Nexus 5X Build/OPM7.181205.001)"
Poking around in react-native code we find the responsible
AssetSourceResolverisLoadedFromServer(): boolean { return !!this.serverUrl; // !!variable === boolean(variable) double negation } isLoadedFromFileSystem(): boolean { return !!(this.jsbundleUrl && this.jsbundleUrl.startsWith('file://')); } defaultAsset(): ResolvedAssetSource { if (this.isLoadedFromServer()) { return this.assetServerURL(); } if (Platform.OS === 'android') { return this.isLoadedFromFileSystem() ? this.drawableFolderInBundle() : this.resourceIdentifierWithoutScale(); } else { return this.scaledAssetURLNearBundle(); } }Now we want to hack the code to fetch assets from device BUT fetch the bundle from our Dev server…
Solution:
In the extracted
index.jsoverridedefaultAsset()to returndrawableFolderInBundle()anddrawableFolderInBundle()to ignorejsbundleUrl. Eventually, the relevant section of the (prettified) bundle should like this:}, { key: "defaultAsset", value: function () { return this.drawableFolderInBundle() } }, { ... }, { key: "drawableFolderInBundle", value: function () { var t = 'file://'; return this.fromSource(t + s(this.asset)) } }, {Backup Plans:
-
If we have the iOS app as well, just copy the
assets/directory from the IPA and place it where Dev Server is loaded from. This works because iOS packaging does not rename nor relocate the assets to store in/drawables/as APKs must do, so the asset tree is kept intact! -
If we don’t have the iOS app then we must reverse the “translation” procedure to re-create the
assets/directory from the/drawables/folder revealed by apktool. That’s left to the reader as an exercise
-
-
You will most likely have errors such as:
Module {HMRClient,AppRegistry} is not a registered callable module (calling enable)Solution: Tick the JS DEV Mode checkbox in Dev settings, disable Debugging, disbale Hot/Live reload, run with
npx react-native start --verbosefrom freshly created-project withnpx react-native init -
Apps using RealmJS, will throw an error like:
Can't use debugger if DEV isn't true…when toggling “JS Debugging” before crashing. Turns out Realm has developed logic to identify if the app is being ran in
chromedebugger, from a set ofreactnative,node.js,electron,jscore and vscodedebuggerenvironments, to then use the respective implementation for a Realm global object.Solution: That’s actually not fixable since this module is correctly written to remove the implementations supporting Chrome’s environment, by wrapping it inif(DEV==true)blocks. These blocks are then stripped by the packager on production builds. -
Also when toggling Debugging, some apps will throw “Invariant Violations” which is React Native lingo for failed assertions. An example would be:
requireNativeComponent: “RCTView” was not found in the UIManagerThese errors are caused by missing code, stripped during minification. Fixing it is a simple matter of
sed -i 's/if(__DEV__)/if(true)/g'on the original code for theUIManager.jsfile of the react-native core module. This is of course not possible as we won’t have access to the original module source on a third-party production application (unless they include the.mapfile!) -
Sometimes you might come across Out of Memory Errors and a stacktrace on the Development server output after a long wait for the bundle to be sent. This would look like this:
 transform[stdout]:
 transform[stdout]: <--- Last few GCs --->
 transform[stdout]:
 transform[stdout]: [24288:0x2b0a560]    73457 ms: Mark-sweep 2033.2 .....
 transform[stdout]:
 transform[stdout]: <--- JS stacktrace --->
 transform[stdout]:
 transform[stdout]: ==== JS stack trace =========================================
 transform[stdout]:
 transform[stdout]:     0: ExitFrame [pc: 0x13a71b9]
 transform[stdout]: Security context: 0x0be6e45008d1 <JSObject>
 transform[stdout]:     1: push [0xbe6e45175b9](this=0x19e2b3372fa1 <JSArray[0]>,....
 transform[stdout]:     2: visitQueue [0x811786c2cc1] ...
 transform[stdout]:
 transform[stderr]: FATAL ERROR: Ineffective mark-compacts near heap limit Allocation failed
 - JavaScript heap out of memory
 transform[stderr]:
Some quick googling helped resolved that, with the solution being to just tell
npmto use more memory! Just add thestart-maxdirective to yourpackage.jsonas below and then restart the server with commandnpm run start-maxinstead: -
While looking for React Native apps to verify my technique upon, I bumped into several cases where after installing an app on the device,
pm path <package>would result to more than one APK locations, as is the case for Pinterest:bullhead:/ $ pm path com.pinterest package:/data/app/com.pinterest-j5uwKoQshpTybYLeGA57AA==/base.apk package:/data/app/com.pinterest-j5uwKoQshpTybYLeGA57AA==/split_config.arm64_v8a.apk package:/data/app/com.pinterest-j5uwKoQshpTybYLeGA57AA==/split_config.en.apk package:/data/app/com.pinterest-j5uwKoQshpTybYLeGA57AA==/split_config.xxhdpi.apkI realised this is caused by the loads of massive native code all the React Native modules introduce. Google’s publishing infrastructure (and even build-tools) then have to split the codebase and a good way to do so is by creating different versions for different device specifications, such as screen sizes, SDK Levels, or even different localisations. Such apps were initially discouraging me from proceeding my analysis for the following 2 reasons:
- My utter bliss on what the heck this was.
- The limitations of my current revere engineering tools -including our own @brut’s
Apktool- that did not support multi-APK repackaging/installation (4-at-once) or any sort of merging capabilities.
Solution: Enter Android Bundles
Repackaging Android Bundles
Quick research led me to the realisation that what I’m seeing is Android Bundles, the new-ish packaging format introduced by Google. To keep this brief I’ll just cut to the chase and point out to the official CLI for these files named bundletool (described here). After some documentation-skimming, I can now follow 2 approaches to repackage Android Bundles:
- If I had the bundle (.aab archive) I could turn it to a fat APK using
bundletool build-apks--mode=universalthen follow repackaging process as usual. Obviously not applicable to this scenario. - Since I’m limited to the 4 APKs that
pm pathpoints to, I can extract them all, decompress and tamper. Thenapktool b && apksigner signand use a third-party app to install them from the device’s SDcard. The most famous app for this purpose is Split APK Installer (SAI)
SAI did install the app, however, the Resources were somehow skipped no matter what options I used, leading to runtime errors as soon as I launch the app…. So no luck here as well.
Summary
After trying with a dozen of third-party apps, all failing in the Debugging step with errors like the ones in cases 5 and 6 I came to the realisation of the underlying problem. I can finally prove why Debugging in Chrome is currently not possible: DEV-only code in either modules or the library itself is going to be stripped out one way or another, so setting breakpoints and Pause-on-Exception behaviour will always be elusive.
Not all hope is lost however! …as live-reloading a local, editable JS bundle works for all apps tested! This allows us to skip a lot of back and forth with repackaging thanks to the “Edit, Shake, Reload” dance!
So yeah, that’s all. That’s how I spent my quarantine non-utililisation time. Before closing I’ll add some useful bits that could be of help to anyone seeking to dive deeper.
- React Native Internals
- Facebook’s f8 app Source Code & Tutorials
- Wait… What Happens When my React Native Application Starts? — An In-depth Look Inside React Native
Now go ahead! Try this technique next time you see a React Native app, and let me know how it went!